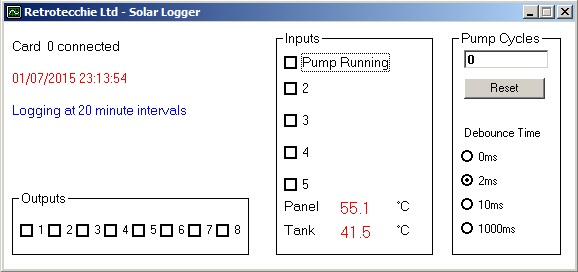
I tackled the creation of a data logger today. Call me old fashioned (well, I am Retrotecchie, after all) but I still like Visual Basic 6.0 for knocking up 'quick and dirty' Windows-based software for my needs. One of the advantages of VB is that most of the 'hobbyist market' PC interfacing kits or modules use standard DLL libraries which are easily accessed from VB with just a few lines of code.
The Velleman K8055/VM110 USB interface modules I have lying around not only have exactly the right I/O (both digital and analogue) but the DLL is exceedingly well documented. The modules also connect to a PC via USB which is nice for the laptop I use in the office as I don't have legacy Com or LPT ports and no way of adding a PCI or PCIe I/O card.
With this in mind, I knocked up a simple data logger today. On the basis that the program can run in the background all the time the laptop is running I decided that between 8am and 5pm when the solar thermal is 'active' a ten-minute logging interval would be fine. Outside those hours, I don't anticipate the system running much (or me being in the office) so I can extend the logging interval to twenty minutes.
The system reads the two temperature sensors on the differential thermostat and converts the voltages to direct Centigrade readout. The status of the pump (running or not) is also recorded.
The daily logging is output to a date-stamped text file, the contents of which can be imported into a LibreOffice Calc (or Microsoft Excel) spreadsheet and the data converted to a graphical representation. It also counts pump cycles so I can get an at a glance status of how many times the pump has run during the logging period.
I can also toggle the digital outputs on the card just in case I want to use the card to control anything...lights, pump system or ancillary systems.
Although I developed this at home today, I've created a sample data file with 'faked' data just to see how it all works. The test board I'm using has a couple of potentiometers which I can manually tweak to simulate temperature readings and pump status. My 'faked' data looks a little like this:
This data can then be imported to a spreadsheet and converted to a graphical representation of system performance. This data can then be compared on a regular basis to see how it performs in different weather conditions or different seasons.
There's tidy. Some cosmetic refinements, and then a little work on the hardware to tidy the electronics up a little and I'm a happy bunny.


No comments:
Post a Comment