It's quite common in electronics. Either something goes wrong due to failure, or you make a hash of something on the bench and you are rewarded with fizzing and popping and the delicate smell of electrical smoke.
I've fried a few components in my time...blown the lids off a few IC's...shorted out the odd regulator...burned out tracks on a circuit board. I think about the worst thing for me was completely corpseing a cheap Chinese inverter and a fairly pricey power meter in the same session. £50 worth, tops.
Today I witnessed the 'release of the smoke-fairy' in full effect. The new job, see? I'm 'babysitting' a hospital in Carmarthenshire. I am temporary stand-in for the regular Engineering Technician who's been forced to take some leave - a case of use it or lose it.
So, there was me planning on several cups of coffee, changing a lightbulb here and there and helping out with some general reshuffling of a couple of offices. That and man the phone and pager waiting to attend to any engineering issues.
My first call of the day was the Operations Manager to say someone had yanked his phone cable out of the wall and broken the plug off the end. Fairly mundane for a man of my calibre. I swapped out his cable with one from a new phone, I can crimp on a new plug, and then swap the cables over again. Happy bunnies all round.
My second call of the day? A strange 'burning smell' coming from the MRI machine electronics rack. Yes, there was a bit of a whiff but to me it didn't smell of 'electricals'. More of a plastic, acrid sort of smell. Well, I wasn't sure what was up, but opened up all the racks and gave everything a good sniff. Nothing but the smell of warm electronics - a perfectly normal smell to my nose. We all decided it was a bit rank, but not as bad as when they called me, and I figured I'd just need to keep an eye on things and see how it went. My gut feeling was nothing untoward, and the smell was probably coming from the air-con unit.
Well, in a way it was the air-con to blame.
Half an hour later after restarting the machine, the pager went again. There was most definitely a smell going on, and not a good one at that. Slightly baffled, I re-sniffed all the racks, shrugged my shoulders, and scratched my head. Now, the reception area just outside the MRI suite was starting to smell, and my nose was finally connecting with my brain and telling me the smell was burning nylon, or at least a nylon-related plastic. Hard to tell with the aircon circulating chilled air, so I turned the aircon off for a few minutes. With no airflow, I then heard the sizzling sounds and smelled the smoke coming from an electronics module up near the ceiling space above the rack.
Not good! I dumped the main power and then ran up the aircon again to try and get rid of the acrid smell. Well, that sorted, the MRI pilot then called the emergency hotline for their engineers and organised a call-out. Obviously being a very expensive and very important bit of medical diagnostic equipment (and way over my technical level) having a specialist on call is an essential need.
Ok...shout me when there's any news, I told the MRI tech.
A few minutes later, I am patrolling the beat and call in to see if there is any update on the engineer. She's on the phone to him at that point, and nodding and "uh-huh"-ing and "yes"-ing and "no"-ing so I wait for her to finish.
Yes, it's possibly the vacuum pump. Could be a power supply? Might be a cooling fan? He's on his way and shouldn't be long. In the meantime, can I possibly put the power back on again as, without the helium and cryogenics operating, the magnetic core of the beast might overheat somewhat catastrophically and very expensively.
Oops! Oh well...power restored to the chillers and disaster averted. So long as the machine proper isn't started up at the control console, then the offending 'fried part' won't be powered and continue to fry.
Live and learn, I say. Only, when I called in later, I was told the engineer had been...yes it was the vacuum pump and/or associated gubbins and yes, something had burned out. Some thing that isn't actually 'used' by the staff, but just happens to be sat there churning away to itself. The engineer had 'unplugged it' and the machine was back up and running again, minus the damaged but unused part. He'll be back out in two weeks to replace it. The unused part...that they don't use. Got me.
Anyway, after that, a loose toilet door handle and a flickering lightbulb were mere trifles!
Monday 27 July 2015
Friday 24 July 2015
Change Of Plans
Well, I'd planned to be doing more paid work over the last few months, but sadly this has not been the case. Times is getting a little tough, pennies-wise, but on the flip-side of that coin (almost down to the last one) I've had a lot of 'van time'.
For the next week, I'm working again! Less to blog about though.
For the next week, I'm working again! Less to blog about though.
Wednesday 22 July 2015
Don't Ask...

With an error of about 0.2v at worst, this corresponds to an error of almost 19 Celcius on the logger. 10mV/K from the sensor, or 10mV per degree...divide that into 0.2v and there is the magnitude of the error. Not only, but also, the errors are worse at higher temperatures...nonlinearity.com...grr.
I did struggle with the DACIO today. The unit has a PP3 battery snap as it's designed to run from a 9v battery. I 'mocked' up a battery using a spare snap and an old power supply I found sculling about, and although it worked seemingly ok, the analogue measurements were somewhat erratic to say the least. Turns out the power supply was actually a battery charger for a model car, and the smoothing and regulation electronics are all in the car. The PSU is simply a transformer/rectifier and was producing almost a volt of ripple on the DACIO chip. In turn, this was putting a small AC component on the Vref of the ADC's, so the values were reflecting this. A smoothing capacitor sorted the problem out nicely. As the final unit will be running from a steady regulated DC supply originating from the solar batteries, this won't be an issue in the real world.
The moral of the story is, don't expect accurate measurements when your measuring tools aren't up to snuff!
So DACIO tested, I'm happy with my coding, the temperatures should be far more accurate and all I need to do now is construct a decent prescaler to offset and gain the sensors. Lucky the pumping system works on pure differentials and not actual temperatures so the system itself hasn't been compromised by dodgy ADC's...just my measurements. Ho hum.
Oh, and I didn't get the job I interviewed for either. It's been one of those days...
Tuesday 21 July 2015
Shelving Upgrade
My temporary shelf that I threw in just to put the stereo somewhere has now been removed and some more permanent Spur and Conti shelving has taken it's place.

The purple cable coming from the facilities is the telemetry cable for the logger. You can just make out the VM110N board I'm currently using as my two-channel logger. The new DACIO has arrived so I just need to make up my prescaler board, write some new software and deploy the new version.
The purple cable coming from the facilities is the telemetry cable for the logger. You can just make out the VM110N board I'm currently using as my two-channel logger. The new DACIO has arrived so I just need to make up my prescaler board, write some new software and deploy the new version.
Whats New?

First roller coat on the main wall of the van.

Lagging on the solar thermal pipework.

Two more solar panels mounted on the front of the van (temporarily) to pull in some late evening sun power. Not best oriented for either tilt or direction, but they boost the batteries enough for the moment.
Sunday 19 July 2015
Ticking Along Nicely

Not much to add, other than I didn't get the logger running until gone 1.30pm. Now logging at 15 minute intervals and saving in CSV format. I've left it running and I'll have a decent plot come Tuesday.
Saturday 18 July 2015
Minor Tweaks
I've just finished tweaking the Datalogger. I changed the logging interval to 15 minutes regardless of time of day so that the graph is now completely linear.
I also changed the format of the logging file from column delimited text to CSV (Comma Separated Values) which just makes importing into a spreadsheet a little bit simpler.
I have been tinkering with a couple of op-amps to make a 'prescaler' for the temperature sensors. A voltage reference of about 2.6v-2.8v (adjustable) is subtracted from the Kelvin value voltages from the sensors to give an output that is closer to Celcius values. Gain of the differential amplifier is also set at x5 so 10-90 Celcius gives almost a full 5v swing to the input of the digitiser.
In order to get a better accuracy (smaller steps) I have also decided to invest in a different board to try as part of the Datalogger package. The new board is the Tronisoft DACIO 300. 8 Analogue inputs and two 8 bit digital IO ports, all connected to the computer via RS232. I have used this board before in another project so I'm comfortable with it.

The downside is that it needs a COM port, so I'll need to use a USB>RS232 dongle on the laptop. This slight disadvantage is more than made up for by the extra capability and resolution of the new board.
Possible expansion of the logger may include indoor and outdoor temperature sensors, monitoring of the solar panel and battery voltages and some other monitoring functions.
Thursday 16 July 2015
Sun Glorious Sun
And Centigrade Glorious Centigrade! I left the logger on for 48 hours...the data was pretty impressive!

I perhaps need to tweak the maths or the sampling interval time in order to linearise the plot. Between 9am and 5pm, the sampling interval is ten minutes. Outside those hours, it's 20 minutes so there is a nonlinearity in the graph. Alternatively, I could interpolate the missing 10 minute intervals or discard alternate readings during the shorter sampling period.
This is what the graph looks like with the 10 minute intervals removed:

I think that does the job. I'm going to compromise and rewrite the logger so it just logs data at identical 15 minute intervals over the whole 24 hour period. It takes a little 'steppiness' out of the graph, too. Until I tweak the hardware, the accuracy of the temperature measurements is +/- 1 step on the digitiser which equates to roughly 1.9 Celcius. Closer tolerance and equal intervals will mean a more readable graph. Even so, as things stand, the performance of the system can be monitored. Even at almost midnight, the tank was holding up at around 42 Celcius. I really don't need hot water then, but it does show that from when the sun comes up, the system doesn't have to lift the water temperature from a very low starting point if there has been good input on a sunny day.
I perhaps need to tweak the maths or the sampling interval time in order to linearise the plot. Between 9am and 5pm, the sampling interval is ten minutes. Outside those hours, it's 20 minutes so there is a nonlinearity in the graph. Alternatively, I could interpolate the missing 10 minute intervals or discard alternate readings during the shorter sampling period.
This is what the graph looks like with the 10 minute intervals removed:
I think that does the job. I'm going to compromise and rewrite the logger so it just logs data at identical 15 minute intervals over the whole 24 hour period. It takes a little 'steppiness' out of the graph, too. Until I tweak the hardware, the accuracy of the temperature measurements is +/- 1 step on the digitiser which equates to roughly 1.9 Celcius. Closer tolerance and equal intervals will mean a more readable graph. Even so, as things stand, the performance of the system can be monitored. Even at almost midnight, the tank was holding up at around 42 Celcius. I really don't need hot water then, but it does show that from when the sun comes up, the system doesn't have to lift the water temperature from a very low starting point if there has been good input on a sunny day.
Sunday 12 July 2015
Disappointing July
I don't know...perhaps August may be better, but I would have expected July to produce some decent performance on the solar thermal. Having said that, I'm not at all disheartened because all I'm using the hot water for is washing up and handwash, and for the volume of water in the calorifier, I can't moan too much. Anything above 40C is good in my book, and temperatures on a variable day like today were pushing 60C. I really ought to leave the logger on long-term and see what the performance is like over a few days. Today in moderately overcast weather, the tank got hot enough for me.

Wednesday 8 July 2015
New Logger
Nothing much to report other than I have tidied up my logging app and made it look a bit more pretty.

Sunday 5 July 2015
Rain Stopped Play
The heavens really opened today. I got to the office just after 10 and although the morning had been rather bright up to that point, as I drove down to the Goat Field the clouds let rip with the most torrential rain I can recall for a long time.
Good news - the water tank started filling nicely.
Bad news - I found some leaks and rain was coming in heavily.
Good news - I think I managed to sort the leaks.
Bad news - data wasn't great today.
There was obviously some sun first thing as the tank temperature was up and the pump had obviously been running. With the VM110N modified to accept digital inputs as a 12v signal rather than a switch to ground, I can now monitor the pump control relay. Before I could do any logging, I made a few minor upgrades to the electrics.

The system simply did nothing at all between me getting the logger running just after noon and the rain drying up and the sun trying it's hardest at about 2.30 or so. Well past noon, so only at an angle to the panel, but managed to pump about 10C extra into the tank.
Thursday 2 July 2015
Real-World Logging
I couldn't have chosen a worse day! There was a lightning strike very close to the house up at The Manor yesterday, and it appears my router has gone on the fritz. As I'd emailed myself the software for the logger to download and install on the laptop, this was not an auspicious start to my day. By the time I'd switched over to the fallback internet connection and checked the van for electrical damage, the clouds had come over and the heavens opened. It was pushing 11am by this time and the panel had seen a little sun, but no action until gone 4pm. Rain for most of the day.
I have real data! It's just not very impressive-looking.

Tank temperature barely exceeded 40C, thanks to a bit of early morning sun and then hovered around the 29-31C mark for most of the day, picking up a little diffuse energy around 4.30pm when the sun had come out again...on the wrong end of the box!
What matters is the data though, not how fantastic it looks. The graph is what counts...the fact that the data is logged automatically and can generate the output required.
Wednesday 1 July 2015
Number Crunching
Today being a Wednesday, I don't go over to the Manor so it's a day catching up on administration or cracking on with a few computer odds and ends.
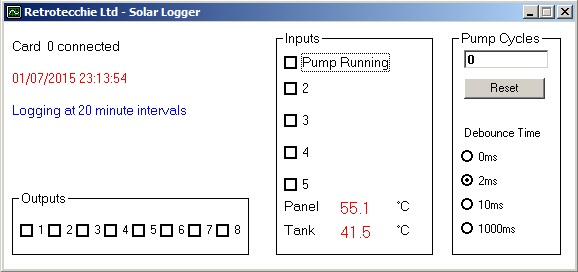
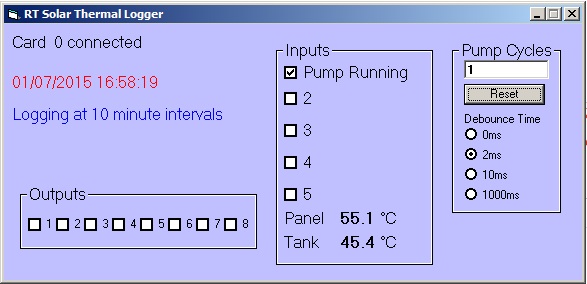
I tackled the creation of a data logger today. Call me old fashioned (well, I am Retrotecchie, after all) but I still like Visual Basic 6.0 for knocking up 'quick and dirty' Windows-based software for my needs. One of the advantages of VB is that most of the 'hobbyist market' PC interfacing kits or modules use standard DLL libraries which are easily accessed from VB with just a few lines of code.
The Velleman K8055/VM110 USB interface modules I have lying around not only have exactly the right I/O (both digital and analogue) but the DLL is exceedingly well documented. The modules also connect to a PC via USB which is nice for the laptop I use in the office as I don't have legacy Com or LPT ports and no way of adding a PCI or PCIe I/O card.
With this in mind, I knocked up a simple data logger today. On the basis that the program can run in the background all the time the laptop is running I decided that between 8am and 5pm when the solar thermal is 'active' a ten-minute logging interval would be fine. Outside those hours, I don't anticipate the system running much (or me being in the office) so I can extend the logging interval to twenty minutes.
The system reads the two temperature sensors on the differential thermostat and converts the voltages to direct Centigrade readout. The status of the pump (running or not) is also recorded.
The daily logging is output to a date-stamped text file, the contents of which can be imported into a LibreOffice Calc (or Microsoft Excel) spreadsheet and the data converted to a graphical representation. It also counts pump cycles so I can get an at a glance status of how many times the pump has run during the logging period.
I can also toggle the digital outputs on the card just in case I want to use the card to control anything...lights, pump system or ancillary systems.
Although I developed this at home today, I've created a sample data file with 'faked' data just to see how it all works. The test board I'm using has a couple of potentiometers which I can manually tweak to simulate temperature readings and pump status. My 'faked' data looks a little like this:
This data can then be imported to a spreadsheet and converted to a graphical representation of system performance. This data can then be compared on a regular basis to see how it performs in different weather conditions or different seasons.

There's tidy. Some cosmetic refinements, and then a little work on the hardware to tidy the electronics up a little and I'm a happy bunny.
Subscribe to:
Posts (Atom)